The OpenTrack website is intended to a be resource for software and hardware pertaining to motion analysis whether it be for biomechanics or physics related purposes. It was created because of the lack of entry level motion analysis solutions for educators interested in introducing their students to the field. While there is no question that many commercial systems are very high quality, such systems are usually cost prohibitive for educators to purchase. Additionally, as digital cameras are now virtually ubiquitous and doubling in resolution and frame rate every few years, it is now possible to do science that is on a par with that done a couple of decades ago using very low cost hardware.
This website contains several components that may be useful to educators and beginning researchers.
- OpenTrack Software for 2D Motion Analysis.
OpenTrack allows users to track discreet points in 2D video, and calculate various 2D
physical parameters. The software is camera-agnostic and is capable of reading a number of
video file formats including *.avi, *.mov, *.mpg, and *.ogv using the ffmpeg library.
The current features include:
- Graphical display of linear kinematics including position, velocity, acceleration, momentum and force.
- Graphical display of angular kinematics including angle, angular velocity, and angular acceleration
- Graphical display of kinetic, potential, and total energies of a marker, as well as some summary information regarding average power dissipated via gravitational potential energy, average kinetic energy per unit time, and change in energy over time.
- Manual digitizing of videos for instructional use.
- Auto digitizing of videos given high contrast (retroreflective markers) and/or fast frame rate (with respect to the motion captured.
- Stick figure (linkage) and marker overlay to images
- Scalable vector graphics outputs
- Built in tutorials and fast learning curve.
- Exportable overlay and graphics in the form of video

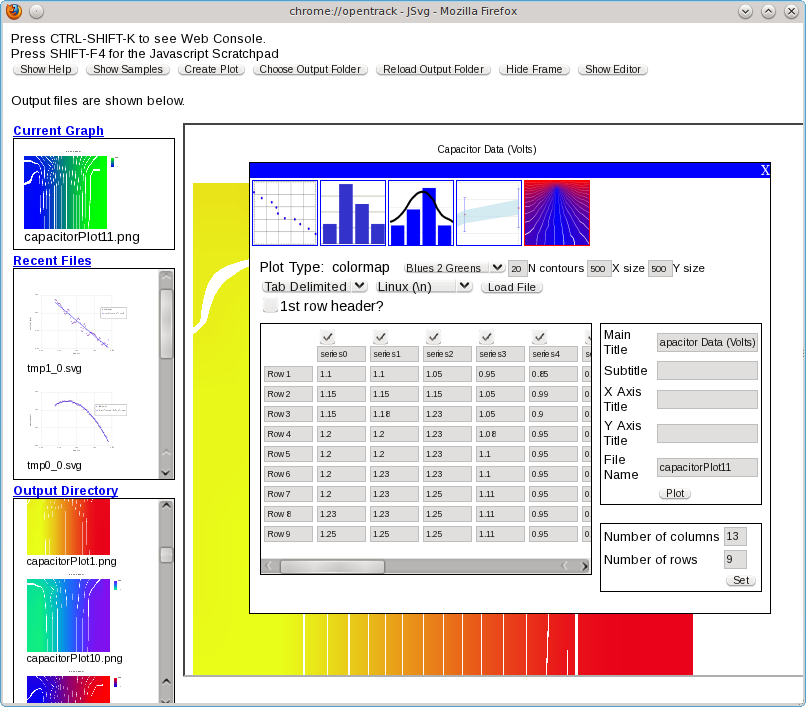
- JSvg Graphics Library for Mozilla
This graphics library is useful for creating Scalable Vector Graphics plots of scientific data and is has the following modes: scatter plot, line plot, bar plot, histogram, stacked barplot, and stacked histogram modes.

- Links to related projects
